
Across the trailing 90 days — July 3 to October 1, 2026 — a daily scraper captured 4,734 public price observations covering 66 compounds, 365 distinct SKUs, and 9 anonymized vendors. Normalized to a per-mg basis, the spread between the cheapest and most expensive well-tracked compounds runs from NAD+ at a $0.10/mg median to AOD-9604 at $11.00/mg — a roughly 106× range inside a single market.
The headline number for anyone planning a purchase is the aggregate stockout rate: 8.3% of vendor-day observations showed a product unavailable, down from 9.4% in the prior window and concentrated heavily in SLU-PP-332 (38.2% OOS), BPC-157 (31.3%), and SS-31 (27.4%). Prices in this market move less than availability does.
This report is the 90-day analysis; for today's per-mg prices across these vendors, see the continuously updated live price index, which also offers the full dataset as a CSV download.
Compare Top Peptides
Best vendor pricing, COA verified, with active discount codes
Methodology
Research-context information only. This report describes industry pricing patterns observed over a trailing 90-day window. Nothing in this report is medical advice, financial advice, or a recommendation to buy or sell any peptide. Peptides discussed are research compounds; most are not approved by the FDA for human use. Consult a licensed physician for personal medical decisions.
Vendor identities are anonymized to maintain editorial independence. Pricing data is normalized to a per-mg basis. All data sourced from publicly-listed vendor prices captured daily during the data window.
The pipeline is simple. A daily scraper visits each tracked vendor's product pages, parses the listed price and stock status, and writes a snapshot row to an offer_price_history table. Each row is one (vendor, SKU, captured-at) tuple. We do not use cached data, retail aggregators, or rumored prices — every observation is a public price visible to any buyer on the day it was captured.
Per-mg normalization is computed as price_cents ÷ (mg_per_vial × vial_count) so a 10-vial bundle of 5mg vials at $400 normalizes to the same $8.00/mg as a single 10mg vial at $80.
For this report, vendors are renamed Vendor A, Vendor B, Vendor C, … using a stable SHA-1 hash of their internal id. The hash sort means a given vendor keeps the same label across successive monthly refreshes — but you cannot reverse-engineer the label back to the vendor without access to the source database. That is intentional.
Median and range figures below are computed from in-stock observations only unless labeled "full window"; stockout rates and volatility figures are computed from all observations.
Cross-Peptide Trends
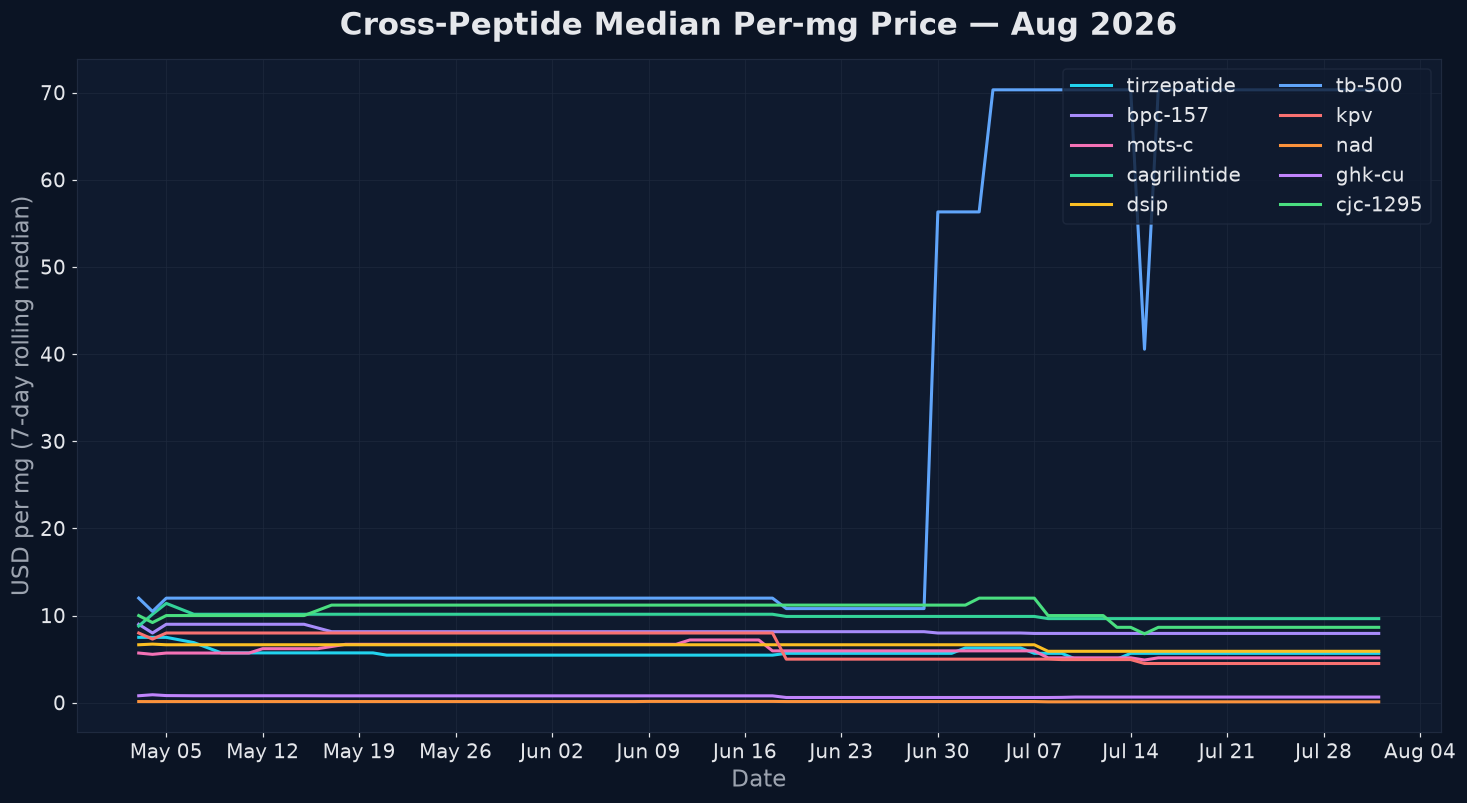
The chart above plots a 7-day rolling median per-mg price for the ten most-tracked peptides over the trailing 90-day window (July 3 – October 1, 2026). Three patterns stand out.
The commodity peptides stayed cheap and stayed put. NAD+ (around $0.10/mg) and GHK-Cu bulk vials (around $0.65/mg) traced essentially flat lines across the full window. These are the compounds sold in 100mg, 500mg, 1000mg, and 1500mg vials, where the per-mg arithmetic collapses the price into commodity territory regardless of what any single vendor does.
The mid-market clustered in a $4–$11 band. Melanotan-2 ($4.30/mg median), KPV ($4.50), selank ($4.75), BPC-157 ($4.90), PT-141 ($4.90), epitalon ($5.00), melanotan-1 ($5.00), pinealon ($5.00), 5-amino-1MQ ($5.20), MOTS-c ($5.40), tirzepatide ($5.67), semax ($6.00), DSIP ($6.00), SS-31 ($6.00), kisspeptin ($6.50), retatrutide ($6.67), thymosin alpha-1 ($7.10), sermorelin ($7.20), CJC-1295 ($8.50), cagrilintide ($8.96), ipamorelin ($10.00), tesamorelin ($10.00), TB-500 ($10.80), and AOD-9604 ($11.00) all landed inside it. That band is where most of the market lives, and it moved very little week to week.
Medians were mostly flat this window — and the one notable rise is composition, not repricing. Comparing the first two weeks against the last two, blended medians held flat for BPC-157, NAD+, and sermorelin, fell for tirzepatide (-5.9%) and GHK-Cu (-9.2%), and rose for retatrutide (+14.3%). A like-for-like check — holding both vendor and vial size constant across the two halves of the window — supports the GHK-Cu decline: every matched GHK-Cu SKU repriced downward, including the 100mg tier at one vendor ($0.65 → $0.59) and the 50mg tier at another ($0.58 → $0.50).
Retatrutide's rise does not survive the same test. Not one matched retatrutide SKU went up: one vendor cut every SKU it carried by 7–46%, a second cut its 10mg and 30mg vials 15% and 4%, and a third cut its 30mg vial 17%. The blended median rose because the mix of vendors and vial sizes captured each day shifted toward higher-priced listings. Tirzepatide's matched SKUs moved in both directions — one vendor's 10mg tier ran $6.90 → $6.00 and its 30mg tier $5.67 → $4.00, while another vendor's 10mg tier went $5.00 → $8.00.
That asymmetry is the most important methodological caveat in this report. Vendor coverage moved from 8 vendors and 53 compounds in July to 7 and 53 in August, then 7 and 49 in September. When the set of vendors being captured changes, the median changes with it — no vendor has to touch a price tag. Blended medians describe what a buyer could see on a given day. The matched-SKU check is what tells you whether anyone actually repriced.
Per-Peptide Deep Dives
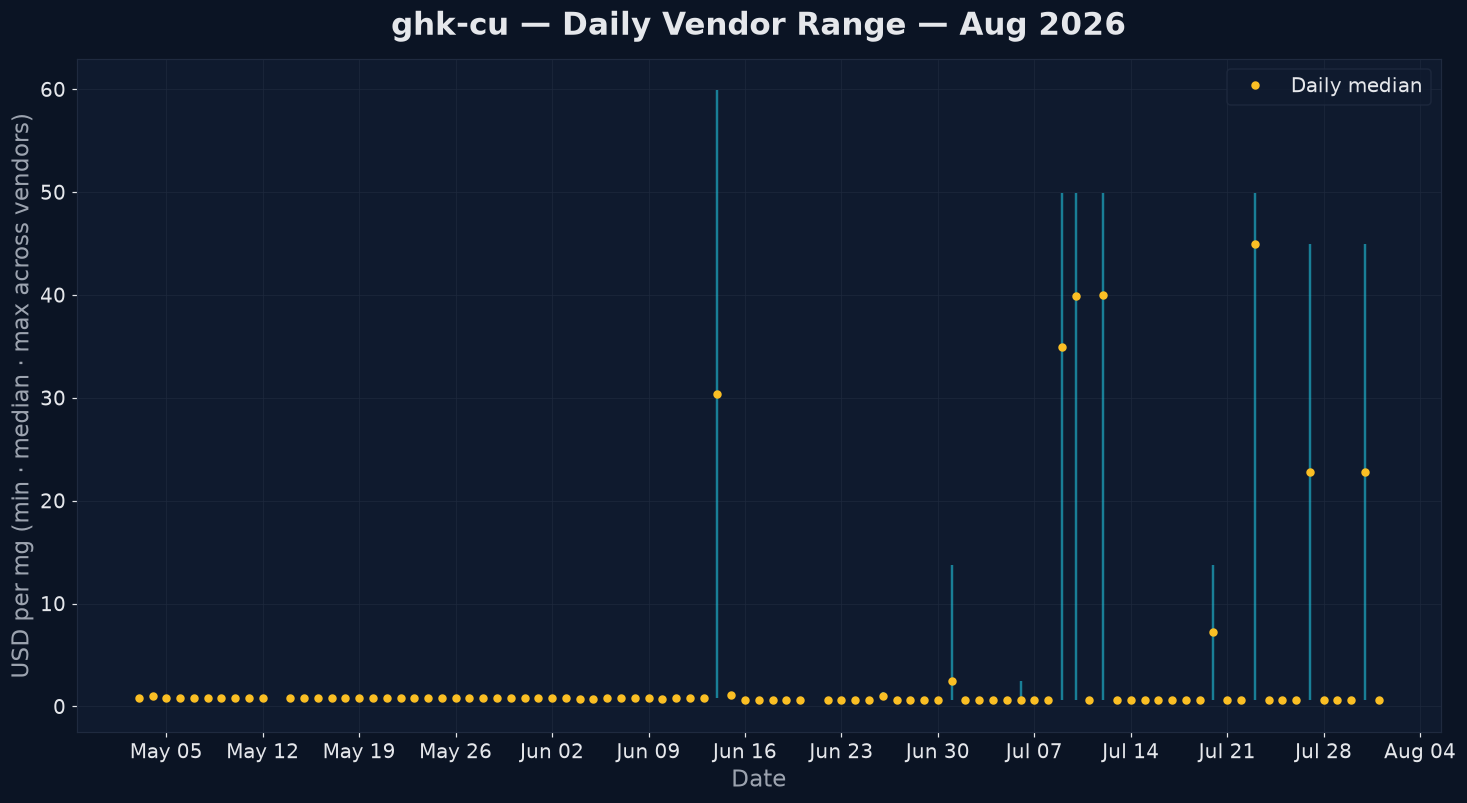
Each of the six peptides below has its own daily-range chart. The vertical wicks show the min-to-max per-mg price across all vendors on that day; the yellow dots are the daily median. No vendor lines, no vendor labels — this is supply-side dispersion only.
Tirzepatide
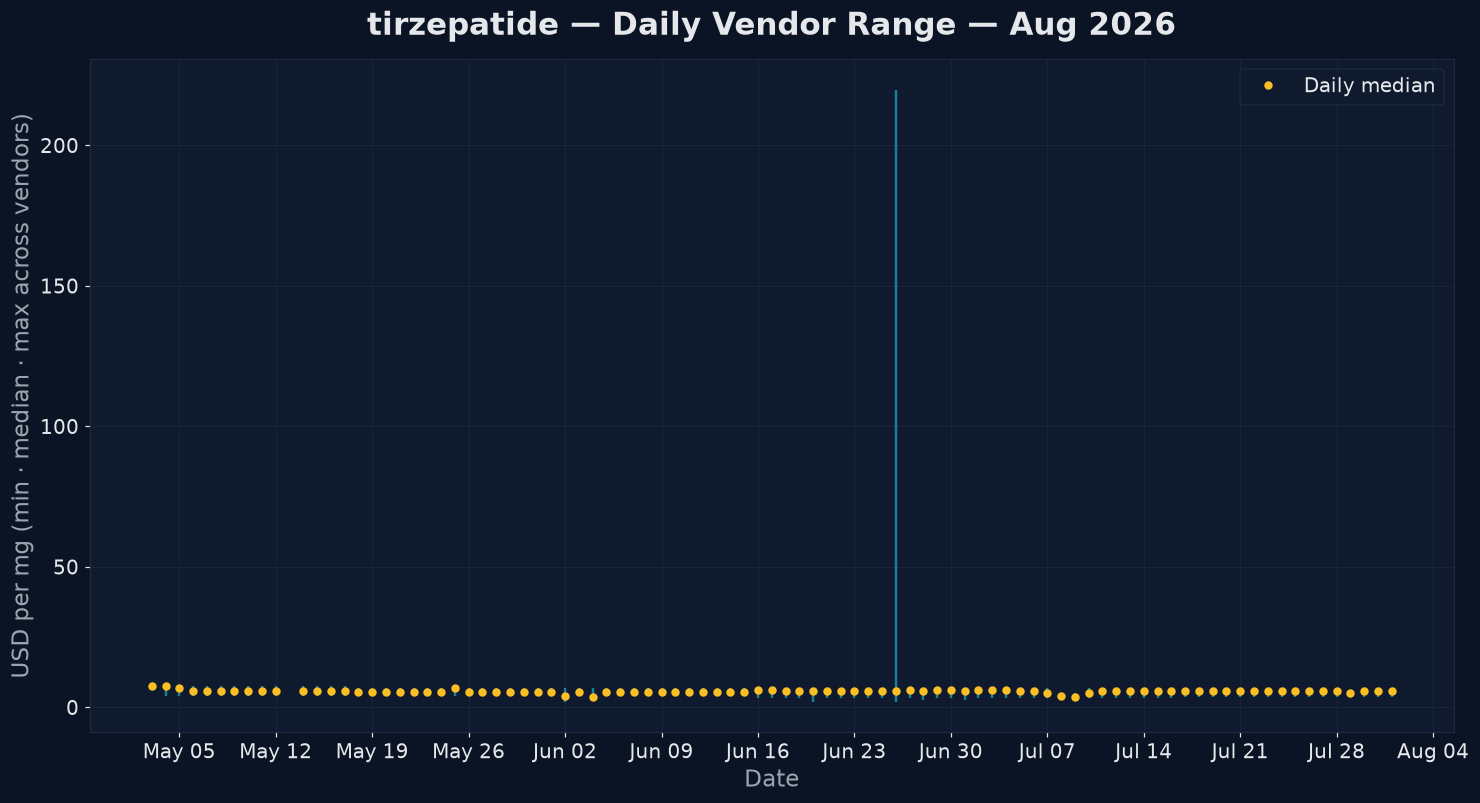
- Observations: 574 across 5 vendors (22 distinct SKUs)
- Median per-mg: $5.67
- Range across full window: $1.27 – $10.50 per mg (95th percentile: $8.00)
- Daily-median pricing changes (>0.5%): 26 across 90 transitions
- OOS rate: 0.9%
Tirzepatide is the most-tracked peptide in the dataset at 574 observations — nearly double the next compound — and it carries the lowest stockout rate of any deep-dive peptide at 0.9%. Supply is deep enough that no shortage pressure is visible anywhere in the window.
The range is also tighter than in prior windows. No extreme trial-size outlier appeared this time: the top of the range is $10.50/mg on an in-stock 10mg vial, and 95.8% of all observations priced at or below $10/mg. The genuine structure is vial-size tiering: 10mg vials ran a $6.90 median, 30mg vials $5.33, and 60mg vials $2.48, with the window's $1.27/mg low also on a 60mg SKU. Per-mg cost falls roughly 2.8× from the 10mg tier to the 60mg tier.
For ranked vendor options, see Best Tirzepatide Vendors.
Tirzepatide is the active ingredient in approved finished pharmaceutical products. The pricing in this dataset is for research-chemical compounded forms, which are not FDA-approved.
Retatrutide

- Observations: 167 across 5 vendors (33 distinct SKUs)
- Median per-mg: $6.67
- Range across full window: $2.60 – $12.50 per mg (95th percentile: $9.67)
- Daily-median pricing changes (>0.5%): 53 across 90 transitions
- OOS rate: 9.6%
Retatrutide has the second-noisiest daily median in the deep-dive set — 53 moves greater than 0.5% across 90 day-to-day transitions, meaning the median shifted on well over half of all comparable days. That is a mechanical effect more than a market one: five vendors carrying 33 SKUs means any single listing going in or out of stock swings the median measurably.
The absolute range is contained — $2.60 to $12.50/mg, under 5×, with no extreme outliers and 98.2% of observations at or below $10/mg. Vial sizes ran from 6mg to 100mg, and the tiering is steep: the 30mg tier carried the bulk of observations (101) at a $6.67 median, while 50mg and 60mg vials ran $3.20 and $3.64. The stockouts sit almost entirely in the thinner tiers — the 30mg tier was out of stock in just 1.0% of its observations, against 37.5–42.9% for the 24mg, 50mg, and 60mg tiers. Retatrutide remains an investigational molecule and supply is visibly thinner than tirzepatide's.
For ranked vendor options, see Best Retatrutide Vendors.
Retatrutide is investigational and not FDA-approved. All pricing is for research-grade material.
BPC-157

- Observations: 150 across 6 vendors (12 distinct SKUs)
- Median per-mg: $4.90
- In-stock range: $2.87 – $5.80 per mg (full-window max $11.00 — out-of-stock 5mg listings)
- Daily-median pricing changes (>0.5%): 14 across 90 transitions
- OOS rate: 31.3%
BPC-157 carries the second-highest stockout rate among compounds with at least 30 observations — 31.3% of its vendor-day observations showed the product unavailable, nearly one in three. Ongoing regulatory pressure around BPC-157 coincides with that inventory strain, though this dataset records availability, not cause.
The strain is not evenly distributed across vial sizes. The 5mg tier was out of stock in 97.7% of its 44 observations; the 10mg tier, with 97 observations, was never out of stock in the window. A buyer's experience of BPC-157 scarcity depends almost entirely on which vial size they are shopping for.
The price picture is tighter than prior windows. The premium-retail 5mg tier that previously pushed BPC-157's 95th percentile above $70/mg did not appear this window. Every in-stock observation priced between $2.87 and $5.80/mg; the $11.00/mg figures in the raw data are 5mg listings that were dark at capture. The daily median moved just 14 times in 90 transitions.
For ranked vendor options, see Best BPC-157 Vendors.
NAD+
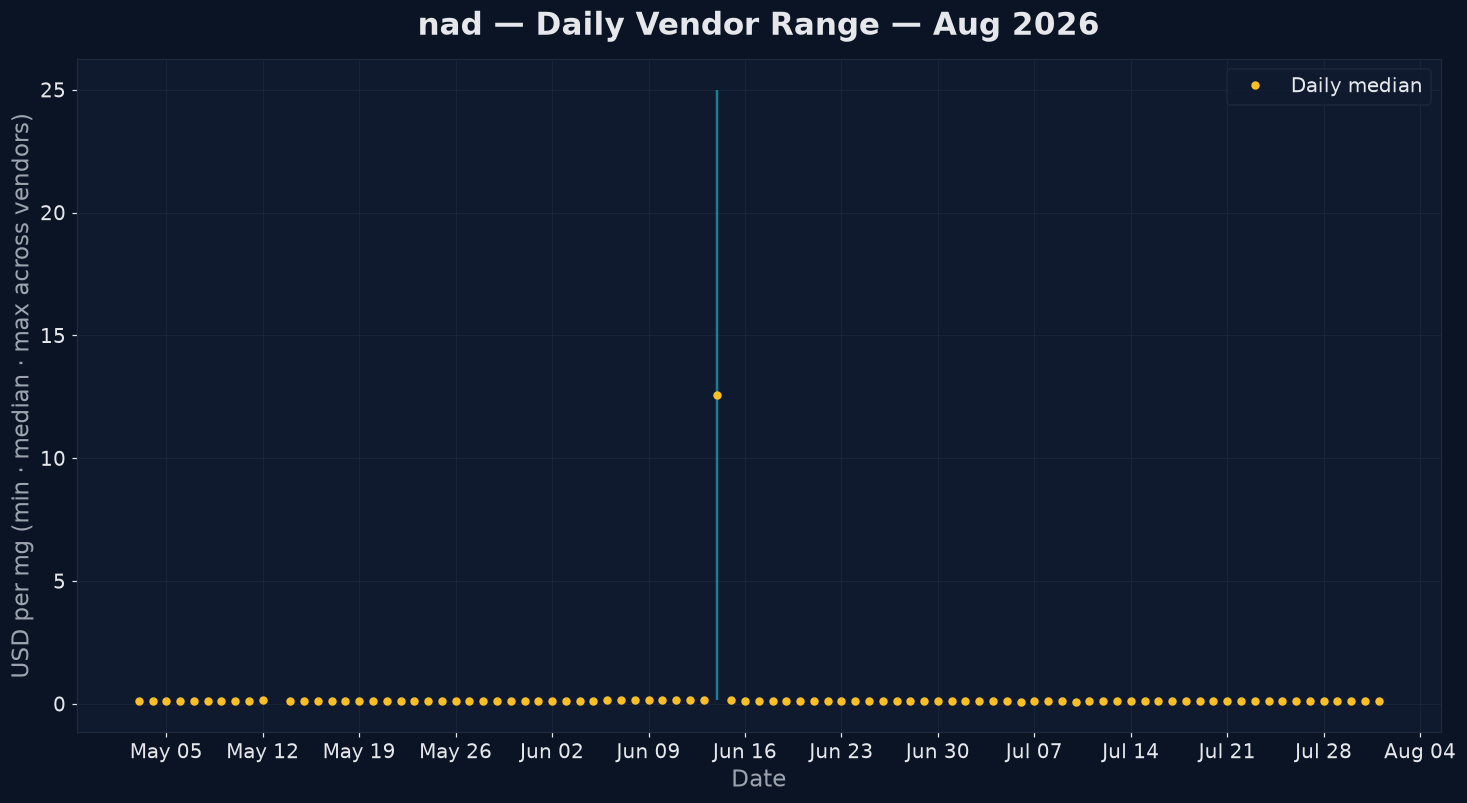
- Observations: 109 across 4 vendors (7 distinct SKUs)
- Median per-mg: $0.10
- Range across full window: $0.054 – $0.16 per mg (95th percentile: $0.11)
- Daily-median pricing changes (>0.5%): 22 across 90 transitions
- OOS rate: 2.8%
NAD+ is the cheapest well-tracked compound in the dataset by more than an order of magnitude, and the reason is vial size: 1000mg vials accounted for 96 of its 109 observations, 88.1% of the total. At that scale the per-mg cost lands in commodity territory — the 1000mg tier ran $0.085 to $0.135/mg with a $0.104 median. The 1500mg SKU in the cohort priced lower still at a $0.077/mg median, and supplied the window's $0.054 low.
The extreme trial-size outlier that previously sent NAD+ to the top of the volatility leaderboard is gone from this window. Its full range now spans less than 3×, and its 13.2% CoV puts it in the lower half of the leaderboard below.
Availability was strong. The 1000mg tier ran a 1.0% stockout rate; the thin 500mg tier was dark in one of its five observations. The blended 2.8% rate is down from 8.7% in the prior window.
Sermorelin
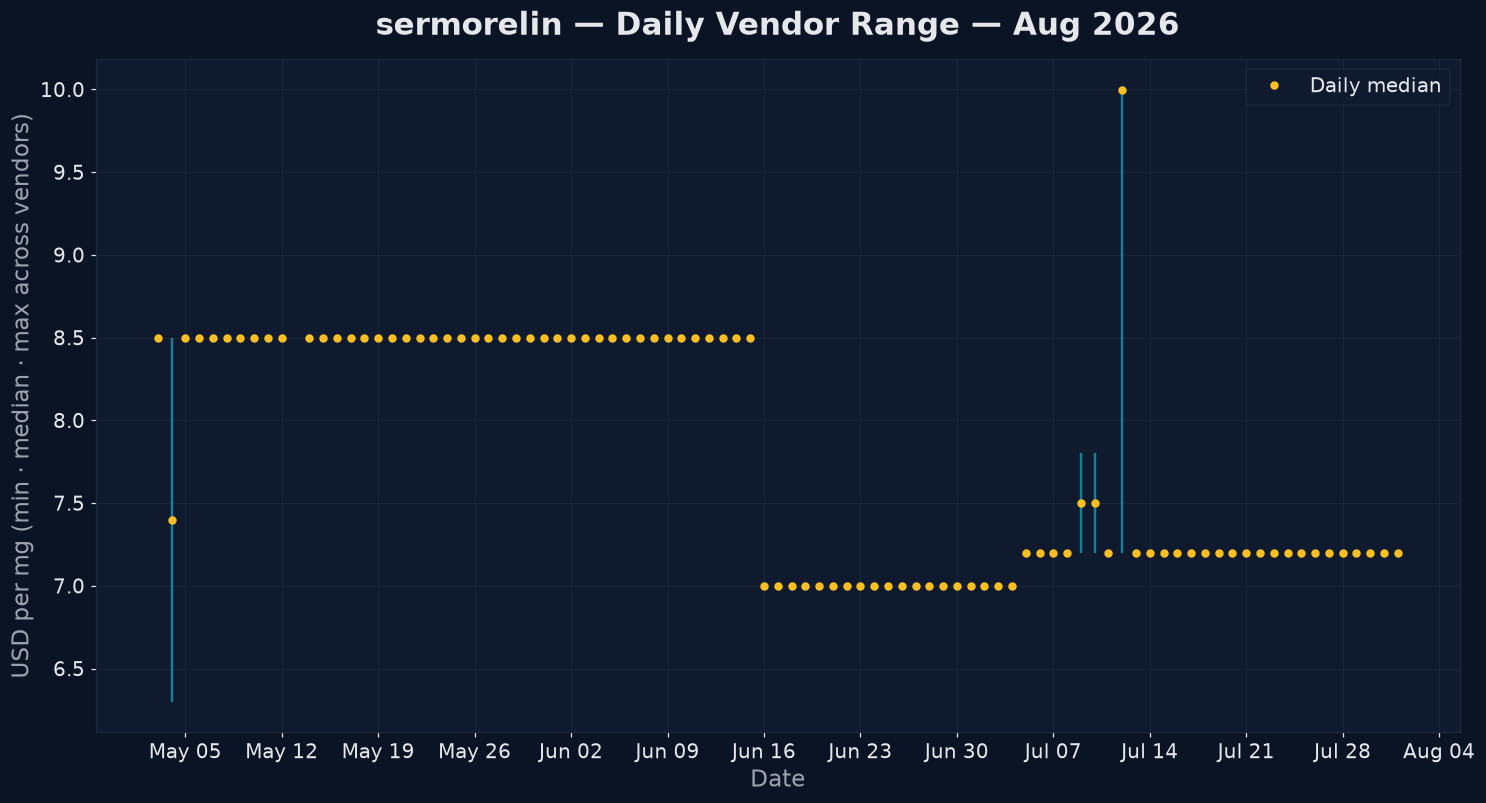
- Observations: 99 across 4 vendors (5 distinct SKUs)
- Median per-mg: $7.20
- Range across full window: $5.04 – $10.00 per mg (95th percentile: $7.20)
- Daily-median pricing changes (>0.5%): 9 across 90 transitions
- OOS rate: 2.0%
Sermorelin is the most stably priced peptide in the deep-dive set: the fewest daily-median changes (9 in 90 transitions), a 6.5% coefficient of variation, a 95th percentile equal to its median, and a 2.0% stockout rate. The 10mg vial supplied 95 of 99 observations and never went out of stock; the only figures above $7.20/mg came from four 5mg observations, two of them dark at capture.
That pattern is consistent with a mature compound: a long history as a GHRH analog, an established compounded-pharmacy channel, and no supply events during the window.
GHK-Cu
- Observations: 211 across 4 vendors (15 distinct SKUs)
- Median per-mg: $0.65 (bulk segment; see below)
- Range across full window: $0.37 – $49.95 per mg
- Daily-median pricing changes (>0.5%): 56 across 90 transitions
- OOS rate: 26.1%
GHK-Cu is the clearest example in the dataset of a compound where a single median hides the market. It splits into two genuinely separate segments rather than a core plus outliers.
The bulk segment — 50mg and 100mg vials, 54.5% of observations — ran a $0.65/mg median across a $0.37–$13.79 range, and its 100mg tier was in stock in 99% of observations. The small-vial segment — 1mg and 2mg SKUs, 45.0% of observations — priced at $26.25–$49.95/mg and its 1mg tier was out of stock more than half the time. These are not the same purchase. Small-vial GHK-Cu at those per-mg prices generally reflects cosmetic and topical formulations, where the buyer is paying for the finished product rather than the raw peptide mass.
The 56 daily-median moves — the most of any deep-dive peptide — are also a segment artifact: as the small-vial SKUs flick in and out of stock, the blended daily median jumps between the two segments. Nothing in the bulk tier moved that often.
Volatility Leaderboard
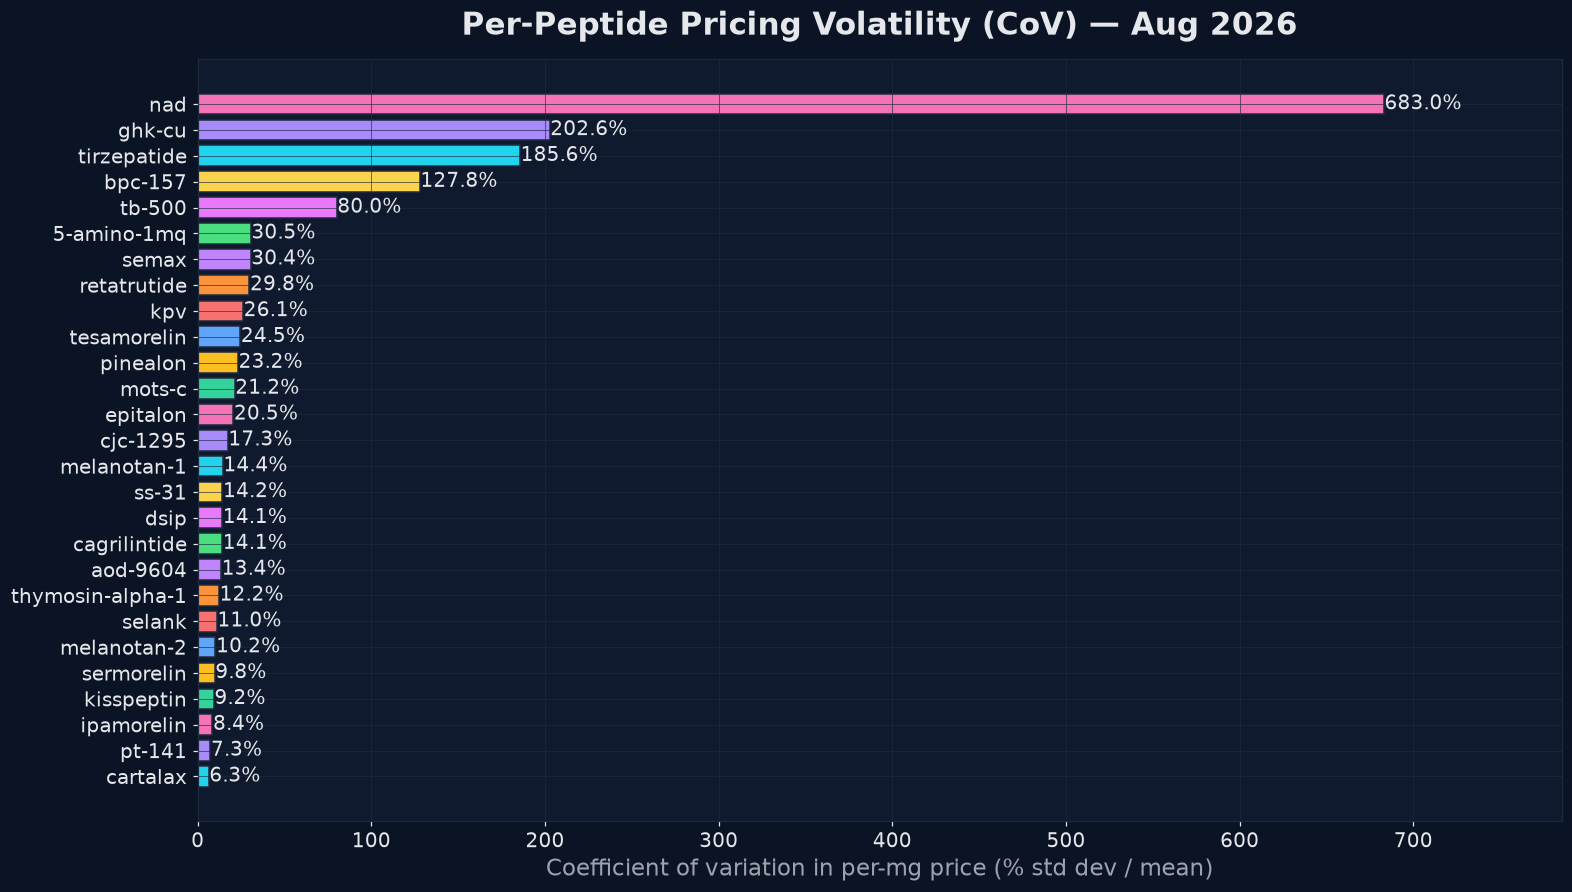
The chart plots the coefficient of variation (CoV) of per-mg pricing for every compound with at least 30 observations in the trailing-90-day window — 29 qualified. CoV = standard deviation ÷ mean, expressed as a percent. Higher = wider spread between vendors, SKUs, and time.
Reading the leaderboard:
- Above 60% CoV: TB-500 (115.7%), GHK-Cu (109.0%), SLU-PP-332 (61.7%). None of these is vendor disagreement on comparable product. GHK-Cu's figure comes from the cosmetic-vs-bulk split. SLU-PP-332 is thinly tracked (34 observations) across 5mg to 50mg vials from five vendors, with per-mg prices tracking vial size. TB-500's comes from a single 5mg listing recorded at $70.32/mg through August 5 and $7.03/mg from August 6 onward — a tenfold step on one day, the signature of a pack-size or listing change rather than a market-wide repricing.
- 30–60% CoV: BPC-157 (42.7%), 5-amino-1MQ (39.6%), semax (33.5%), retatrutide (32.7%). BPC-157's figure is driven by out-of-stock 5mg listings at $11.00/mg and 5-amino-1MQ's by the 10mg-vs-50mg vial split. Semax and retatrutide are the cleanest cases of genuine vendor price dispersion — semax's 10mg vial ranged from $3.29 to $7.50/mg across vendors.
- 15–30% CoV: tirzepatide (29.4%), AOD-9604 (22.0%), CJC-1295 (20.9%), SS-31 (19.8%), tesofensine (19.7%), MOTS-c (17.8%), epitalon (16.6%), selank (16.2%), PT-141 (15.2%). The comparison-shopping zone — real spread between vendors on the same product.
- Below 15% CoV: DSIP (14.8%), tesamorelin (13.2%), NAD+ (13.2%), cagrilintide (11.6%), melanotan-2 (11.1%), kisspeptin (10.6%), pinealon (10.3%), ipamorelin (9.7%), thymosin alpha-1 (9.4%), melanotan-1 (7.1%), sermorelin (6.5%), cartalax (5.9%), KPV (5.4%). Thirteen of the 29 tracked compounds price within a tight band across every vendor in the cohort.
The practical read: a high CoV number on this chart is a prompt to check what is being compared, not automatically a signal that one vendor is overcharging. Sometimes it is vial size (5-amino-1MQ, tirzepatide), sometimes it is a cosmetic-versus-research channel split (GHK-Cu), sometimes it is a single listing change (TB-500) — and sometimes, as with semax and retatrutide, it is straightforward vendor price dispersion on the same thing.
Supply Patterns

The heatmap above shows OOS rate per peptide per ISO week. Darker = more vendor-days marked out of stock during that week.
Aggregate stockout rate for the window: 8.3%, meaning roughly one in twelve vendor-day observations across the dataset showed a product as unavailable. That is a better supply picture than the preceding window, which ran at 9.4%.
The weekly trend improved across the window. Two spikes dominate the first half: the window's worst reading of 19.1% in the week of July 6 and a second spike of 16.1% in the week of August 3. From mid-August onward the dataset never rose above 8.0% in any week, and every September week ran between 4.2% and 7.0%. The supply events that defined the summer did not recur in September.
Concentration matters more than the aggregate. The compounds carrying sustained dark bands are SLU-PP-332 (38.2% OOS), BPC-157 (31.3%), SS-31 (27.4%), and GHK-Cu (26.1%). Below those four the drop is steep: PT-141 at 14.0%, cartalax at 11.0%, retatrutide and AOD-9604 at 9.6%, and everything else in single digits. The dataset's 8.3% aggregate is not a market-wide scarcity signal — it is four compounds under real pressure and a long tail that is broadly well-stocked.
Stockout patterns also interact with price. When one or two vendors go dark, the median per-mg price visible to buyers can drift upward simply because the cheapest vendor disappeared from the cohort — the same composition effect described in the cross-peptide section. GHK-Cu's 56 daily-median moves and retatrutide's 53 both trace back to stock flicker and listing mix rather than repricing. The price chart and the OOS chart are best read together.
What This Means for Buyers
Generic, evergreen guidance based on the patterns visible across the window:
Check vial size before concluding a vendor is expensive. This is the single largest source of apparent price difference in the dataset. Tirzepatide's per-mg cost fell roughly 2.8× from its 10mg tier to its 60mg tier. NAD+'s entire ~106× advantage over mid-market peptides is vial-size arithmetic. Retatrutide's 60mg tier priced at roughly half its 30mg tier.
Check the channel too. Vial size explains most dispersion but not all of it. GHK-Cu's 1mg and 2mg cosmetic-format listings priced at $26.25–$49.95/mg in the same window its 100mg research vials ran $0.65/mg. A premium-retail listing and a research-supply listing can look like the same product on a search results page.
Comparison shopping pays on some compounds and not others. Semax, retatrutide, AOD-9604, CJC-1295, SS-31, and MOTS-c showed 18–34% CoV — real vendor-to-vendor spread. Sermorelin, KPV, cartalax, melanotan-1, thymosin alpha-1, ipamorelin, and kisspeptin all sat under 11%, where the delta between vendors is smaller than the difference shipping speed or COA documentation makes.
Availability is the binding constraint on a few compounds, not most. With SLU-PP-332 at 38.2% and BPC-157 at 31.3% OOS, a buyer's practical problem on those compounds is finding stock rather than finding a good price. But the constraint is often tier-specific: BPC-157's 5mg vials were dark 97.7% of the time while its 10mg vials never went out of stock at all.
Per-mg, not per-vial. Vial sizes in this dataset ranged from 1mg to 1500mg. Comparing dollar prices without normalizing to per-mg is the largest avoidable source of overpaying in this market.
Premium small-vial SKUs distort every summary statistic. When a peptide shows a max per-mg price 5–10× its median, it is almost always a 1mg, 2mg, or 5mg trial-size or cosmetic SKU at full retail. GHK-Cu's 1mg tier priced roughly 46× above its 100mg tier for what is nominally the same compound.
End-of-month vs. mid-month. This window was not granular enough to confirm end-of-month promotional pricing as a reliable pattern. Some vendors run periodic clearance events; others price flat. Future refreshes will track this more carefully.
If you want a vendor starting point without doing your own daily price tracking, our Best Peptide Vendors of 2026 compares the top-rated vendors on price, COA documentation, shipping reliability, and reputation. That ranking is updated continuously as data shifts.
Methodology Limitations
In the spirit of editorial independence, the limitations of this dataset:
- The window covers July 3 – October 1, 2026 (trailing 90 days), with data captured on 91 of those days. Each monthly refresh rolls this window forward, so the figures always describe the most recent quarter of live prices rather than a fixed calendar quarter.
- Cohort composition changed during the window. Coverage moved from 8 vendors and 53 compounds in July to 7 and 53 in August, then 7 and 49 in September. When the captured vendor set changes, blended medians move without anyone repricing. This report includes a matched-SKU check (same vendor, same vial size, both halves of the window) to separate the two, and the cross-peptide section reports where the two disagree.
- Per-mg normalization assumes purity parity. It does not hold. Two vendors selling 10mg of "BPC-157" may ship different actual peptide quantities depending on assay results. This dataset takes the listed mg figure at face value and does not adjust for COA-reported purity.
- Bundle SKUs were normalized as
mg_per_vial × vial_count. This is the right adjustment for buyers comparing per-mg cost, but it slightly compresses the apparent vendor-spread for peptides where bundle pricing varies significantly per-vial. A listing whose recorded pack size changes mid-window — as appears to have happened on one TB-500 listing on August 6 — shows up as a step change in per-mg price. - Cosmetic, topical, and premium-retail listings are priced alongside research-grade vials. GHK-Cu is the clearest case — its small-vial SKUs are finished consumer products, not raw research material, but they normalize into the same per-mg column. This inflates both the range and the CoV for any compound sold through both channels.
- Nine vendors is a meaningful slice but not exhaustive. The cohort skews toward English-language US-shipping research-grade vendors. Non-US vendors and prescription-only compounded sources are not in this dataset.
- Anonymization is an editorial choice, not a privacy requirement. All prices in this dataset were public on vendor websites at the time of capture. We anonymize because it lets us report on industry-wide patterns without our affiliate relationships influencing the analysis.
- The OOS flag reflects what the vendor's website displayed. Some vendors mark a SKU as "available — backorder 7 days," which we treat as in-stock; others show "out of stock" the moment inventory hits zero. Inter-vendor stock-status reporting is not strictly comparable.
- Thin tiers carry outsized weight in blended rates. Retatrutide's 9.6% stockout rate sits almost entirely in its 24mg, 50mg, and 60mg tiers; its 30mg tier, with 101 observations, ran 1.0%. Any figure computed across a peptide's full SKU set should be read alongside the per-tier breakdown.
Coming Next
This report refreshes monthly, with each version covering a rolling trailing-90-day window on full daily scraper cadence. The chart set and anonymization scheme stay constant across refreshes so successive versions are directly comparable.
Planned additions to future refreshes:
- Vial-size-normalized medians — per-mg figures computed within matched SKU tiers, so headline numbers stop moving when the SKU mix changes
- Channel segmentation — separating premium-retail listings from research-supply listings before computing dispersion, so CoV measures vendor disagreement rather than market structure
- Period-over-period delta for every peptide with a stable vendor cohort across successive windows
- End-of-month vs. mid-month pricing pattern test
- Stockout-to-price-recovery lag — how many days between OOS-onset and post-restock pricing returning to baseline
Where to buy if you're researching options
For most readers landing here from FDA / vendor / pricing coverage, the two highest-utility next-stops on this site are:
- Retatrutide for sale — vendor price comparison — vendor pricing, COA verification, vial-size tradeoffs for the highest-search-volume peptide of 2026
- Best Peptide Vendors of 2026 — head-to-head vendor comparison ranked by price, COA documentation, and reputation